Grids
The Analyzer provides grid-level insights, including power flows, grid constraints, and the impact of market activities on grid stability. The following visualizations help assess grid performance, bottlenecks, and flexibility needs.
Grid-Level Visualizations
1. Grid Load Over Time
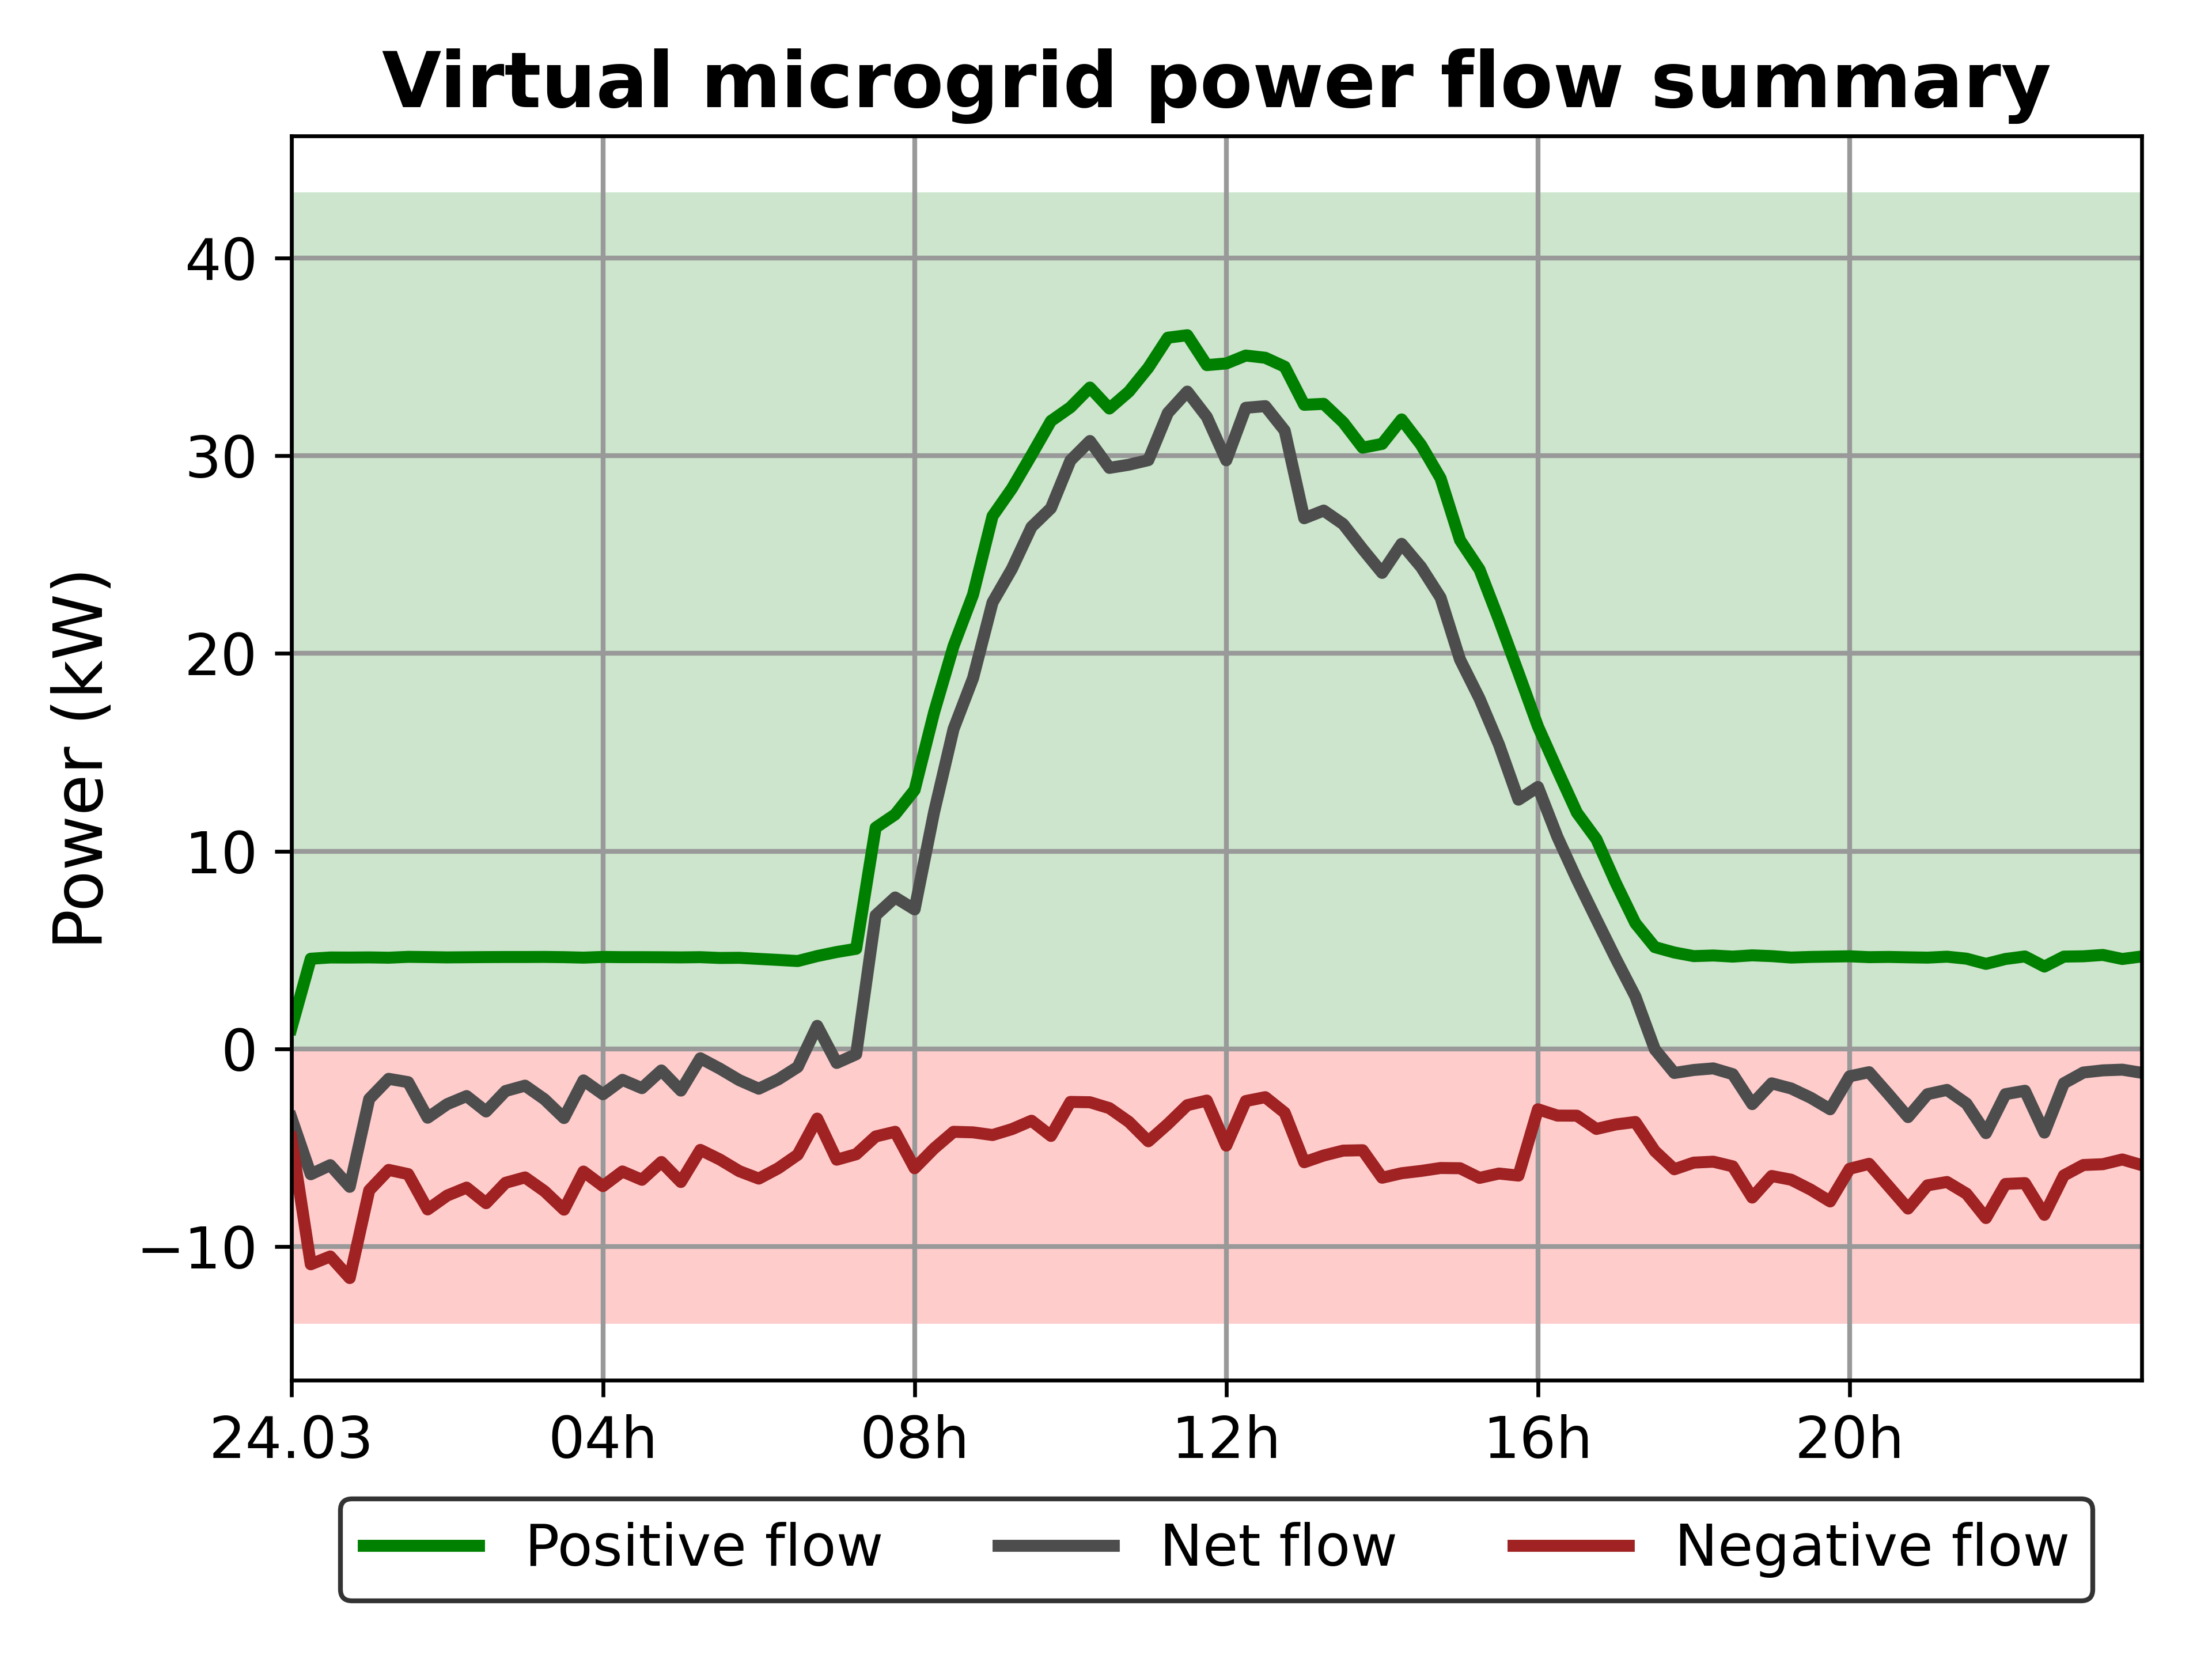
Displays the total power demand in the grid over time.
Helps assess peak demand periods and potential grid congestion.
Useful for evaluating how renewable generation and flexible demand affect grid stability.